


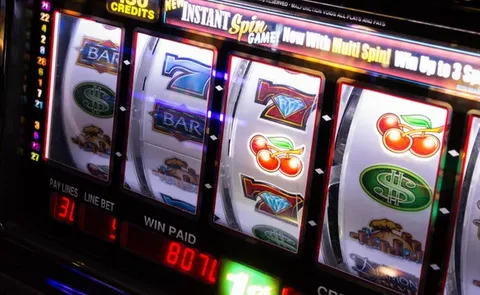
95.388%. The precision is real and mathematically justified. It is also, for any individual player, almost entirely decorative.
Online slots publish return-to-player figures with striking precision. Not 95%, but 95.388%. Not 94%, but 94.995%. Three decimal places, presented as though the difference mattered.
The precision is not invented. It falls out of how the figures are produced. Whether it means anything to a player is a separate question, and the answer is mostly no.
Where the decimals come from
A slot’s return is not measured by observing play. It is calculated from the game’s mathematical model — every possible reel combination, its probability, and its payout, summed across the entire outcome space.
That produces an exact figure with as many decimal places as you care to carry. A 2006 title from the British studio Eyecon, still among the most played games in its category, calculates out at 95.388%. The number is a property of the model, not an estimate.
Testing laboratories then verify it by simulating very large numbers of spins and confirming convergence on the calculated value.
So the precision is honest. The question is what a player can do with it.
Why it does not help you
Return to player describes behaviour across the game’s full mathematical lifetime — hundreds of millions of spins. Over any human-scale number of spins, variance dominates completely.
The gap between 95.388% and 95% is 0.388 percentage points. At 700 spins an hour and £1 a spin, that is £2.72 an hour of expected difference — entirely invisible inside the swing of ordinary session outcomes, which can run hundreds of pounds either way.
The third decimal place represents fractions of a penny per spin. It is real, and it is not something anyone experiences.
| Figure | Precision | Use to a player |
| RTP to 3 decimals | Exact from the model | Minimal — variance swamps it |
| Volatility rating | Coarse, 1–5 | High — describes the session |
| Hit frequency | Percentage | Moderate, with caveats |
| Stake per spin | Exact, chosen by you | Total — the main lever |
The figures that do matter
The coarser numbers are the useful ones, which is the opposite of what the presentation implies.
Volatility, published as a rough rating rather than a precise figure, determines how a balance behaves. Hit frequency describes how often anything lands — with the standing caveat that “a win” includes wins smaller than the stake, so a game reporting a hit rate around 41.5% is paying something on roughly two spins in five while still steadily reducing the balance.
That combination — a high hit rate producing frequent sub-stake returns — is precisely the pattern that makes players overestimate how well a session is going. Analyses that work through it properly, such as Fluffy Favourites’ 95.388% RTP explained, set the hit rate against the return figure rather than reporting either alone, which is the only way the two make sense together.
How the figure gets verified
The calculated return is one thing; confirming the shipped game actually behaves that way is another, and the verification method is worth knowing.
Testing laboratories run the certified build through very large simulated spin volumes — commonly in the hundreds of millions — and confirm the observed return converges on the calculated figure within a tight tolerance. Convergence at that scale is the whole basis for confidence in the published number.
The scale involved is exactly why the figure says nothing about a session. Convergence requires hundreds of millions of spins. A player might produce a few thousand in a year. The number is verified true at a scale no individual will ever approach, which is not a criticism of the number — it is simply what a long-run average is.
It also explains why “this game hasn’t paid its RTP today” is a meaningless complaint. The figure was never a promise about today. It is a property of the model, confirmed at a scale where individual experience has no bearing.
Why the precision persists
Partly because it is accurate and there is no reason to round. Partly because precision reads as rigour — a figure to three decimals carries an implication of measurement and care.
That implication is doing work the number cannot support. A precisely stated house edge is still a house edge, and knowing it to the third decimal place changes nothing about the direction it points.
The useful reading is: check the RTP to establish roughly where a game sits, in the game’s own information screen rather than a review, since studios ship multiple builds of some titles. Then ignore the decimals and look at volatility and your own stake, which are the two things that actually determine what happens.
The pattern is a familiar one in consumer information generally: precision offered where it is cheap and irrelevant, absent where it would be useful and costly. Three decimal places on a long-run average is precision nobody can act on. A distribution of session outcomes would be precision anyone could act on, and it is exactly the figure that does not appear.
Requiring it would not be technically difficult. The model that produces the return figure to three decimal places can produce a session-outcome distribution just as readily, and studios already compute far more than they publish. What is missing is not capability but any obligation to disclose the one number that would let a player see the product clearly.
Operators outside British licensing carry no GAMSTOP coverage and no British dispute route. Anyone registered with the scheme should keep that protection. Free confidential support: BeGambleAware. 18+.
